The 50,667 average is heavily concentrated in August
August supplied 87.5% of the US net payroll gain over the latest three months. The monthly mean of about 50,667 exceeds the prior 12-month average of 45,000, but treating that mean as proof of recovery misses the concentration. Before buying stocks on rate-cut hopes, check whether the new month's jobs and company sales hold up together.
The BLS October 2 release revised nonfarm payroll changes to −10,000 in July, +133,000 in August and +29,000 in September. Their sum is +152,000; August's share is 133,000÷152,000=87.5%. September also fell below the prior 12-month monthly average of 45,000.
One tall August bar supports the three-month mean. A high average and a revival in new-month job creation are distinct judgments. These observations give thin support for turning a claim that jobs are holding up directly into confidence in company sales.
| Month or window | Net payroll change | What it shows |
|---|---|---|
| July | −10,000 | Revised to a decline |
| August | +133,000 | 87.5% of the three-month net gain |
| September | +29,000 | Below the prior 12-month average |
| Jul–Sep total | +152,000 | Sum of three net changes |
| Jul–Sep monthly mean | +50,667 | Total divided by three, rounded |
| 12-month mean before September | +45,000 | BLS release comparison |
Seasonally adjusted nonfarm payroll net changes. The 87.5% denominator is the net gain of 152,000, not total newly hired people.
The average could rise with zero October jobs added
A report that the next three-month mean improved could sound like stronger job creation. But July's −10,000 will leave the window. Separate the effect of a weak month dropping out from a stronger new month entering.
To illustrate the calculation, assume no August or September revisions and an October net change of zero. The new average is (133,000+29,000+0)÷3=54,000. Adding a month with no net gain still raises the mean above about 50,667 because July's decline of 10,000 drops out.
In the next release, start with the three inputs: revised August, revised September and the new October change. Without revisions, the average changes by (October change−July change)÷3. That check helps avoid buying a recovery based on the mean alone.
| Comparison | Inputs | Three-month mean |
|---|---|---|
| Reported Jul–Sep | (−10,000+133,000+29,000)÷3 | About 50,667 |
| Illustrative Aug–Oct with zero October | (133,000+29,000+0)÷3 | 54,000 |
October's zero in the second row is an assumption to explain the average, with no August or September revisions. The actual next mean depends on new observations and revisions.
A 60,000 downward revision changes the base of optimism
July changed from +21,000 to −10,000; August changed from +162,000 to +133,000. Those are reductions of 31,000 and 29,000, lowering the combined estimate for the earlier two months by 60,000.
The 60,000 does not mean 60,000 people were newly laid off in September. Additional establishment responses and recalculated seasonal factors changed earlier estimates. A view that employment was stronger than expected needs its base recalculated too. August and September's payroll estimates remain preliminary.
The counterevidence remains that the revised three-month average exceeds the prior 12-month mean. But July is negative and September adds only 29,000. Whalehunter's judgment is that the improved average alone gives thin support for buying a recovery. New payroll observations and revisions can change that view.
| Month | Previous release | As of Oct 2 | Revision |
|---|---|---|---|
| July | +21,000 | −10,000 | −31,000 |
| August | +162,000 | +133,000 | −29,000 |
| Jul–Aug total | +183,000 | +123,000 | −60,000 |
Revisions to seasonally adjusted payroll net-change estimates, distinct from changes in the number of unemployed people.
A 4.2% unemployment rate does not establish collapsing consumption
Unemployment rose from 4.1% in August to 4.2% in September. BLS described both payroll employment and unemployment as little changed. Participation increased from 61.6% to 61.8%, while the employment-population ratio rose from 59.1% to 59.2%. Household-survey employment and unemployment both increased, so unemployment's rise alone does not describe large-scale job destruction.
Keep jobs and people separate. The establishment survey counts payroll jobs; the household survey counts people's employment and job-search status. The labor force is the unemployment-rate denominator. A person with two jobs is counted differently across surveys, so subtracting unemployed people from nonfarm payroll changes is not a valid comparison.
Consumption also depends on more than the number of jobs. Average private hourly earnings reached $37.81, up 0.1% monthly and 3.0% annually; the average workweek stayed at 34.4 hours. The release does not show jobs, pay and hours all falling together. Average wages also depend on the worker mix, so the average increase is not the raise every worker received.
| Household survey · Seasonally adjusted | August | September |
|---|---|---|
| Unemployment rate | 4.1% | 4.2% |
| Labor-force participation rate | 61.6% | 61.8% |
| Employment-population ratio | 59.1% | 59.2% |
| Employed people, thousands | 162,746 | 163,152 |
| Unemployed people, thousands | 7,031 | 7,109 |
This household survey counts people. Its population and counting method differ from the establishment payroll changes above.
Even if a rate cut helps, does your company still have orders?
Weaker jobs can reduce wage and demand overheating and support policy easing. If that expectation lowers the yield for my bond's maturity, it helps a fixed-rate bond's price. Stocks need an additional condition: the earnings being discounted at that lower rate must hold up.
In a company's results, begin with new orders, sales volume and the revenue outlook, then compare labor costs and margins. If orders hold and wage pressure eases, a cost benefit can remain. If orders and revenue fall, lost demand can absorb the rate benefit. The jobs average cannot explain which path my company follows.
If net payroll changes, hours and wages weaken together and the company's revenue outlook also falls, the case for calling lower rates a pure stock benefit thins. If revisions stabilize and new jobs and hours hold while inflation pressure eases, the conflict between rates and earnings may shrink. Write down which conditions the stock I own depends on.
On November 6, check the month that left an improving average
The next jobs report covers October and is scheduled for November 6, 2026, at 08:30 US Eastern Time, or 22:30 KST. US daylight saving time will have ended, making the Korean release time one hour later than on October 2.
The first calculation is (revised August+revised September+new October)÷3. If the average rises, separate a stronger new month from the effect of July's −10,000 leaving the window. Then compare unemployment with participation and the employment-population ratio, followed by pay and hours.
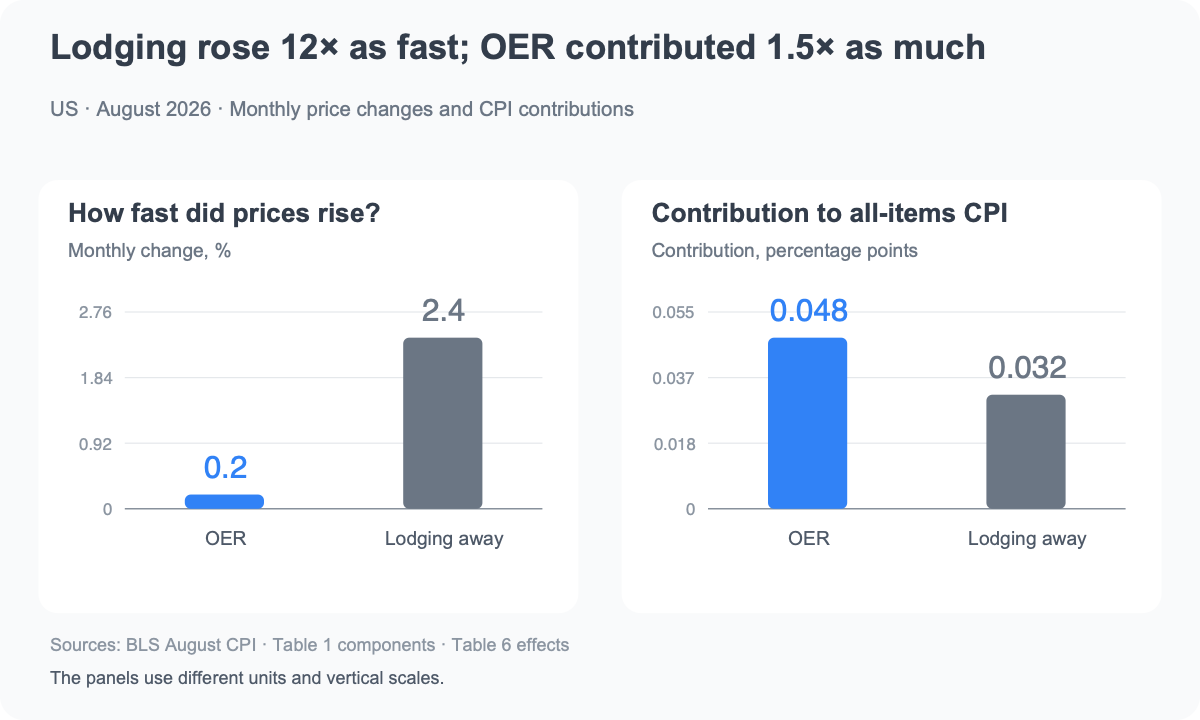
Before that comes the October 14 inflation release. Read whether inflation pressure eased while company demand held up to connect rate expectations with a stock decision. Continue with why OER's small rise contributed more to CPI than lodging's much larger one.
Next checks
- Recalculate the mean using revised August, revised September and new October
- Separate new payroll strength from July's −10,000 dropping out
- Compare unemployment, participation, the employment ratio, pay and hours